Live activity
Follow upload and download speed, active interfaces, and per-process traffic.
Network inspection
MachKit collects the network details usually scattered across Activity Monitor, System Settings, and terminal commands, then presents them in one readable workspace without sending connection data elsewhere.
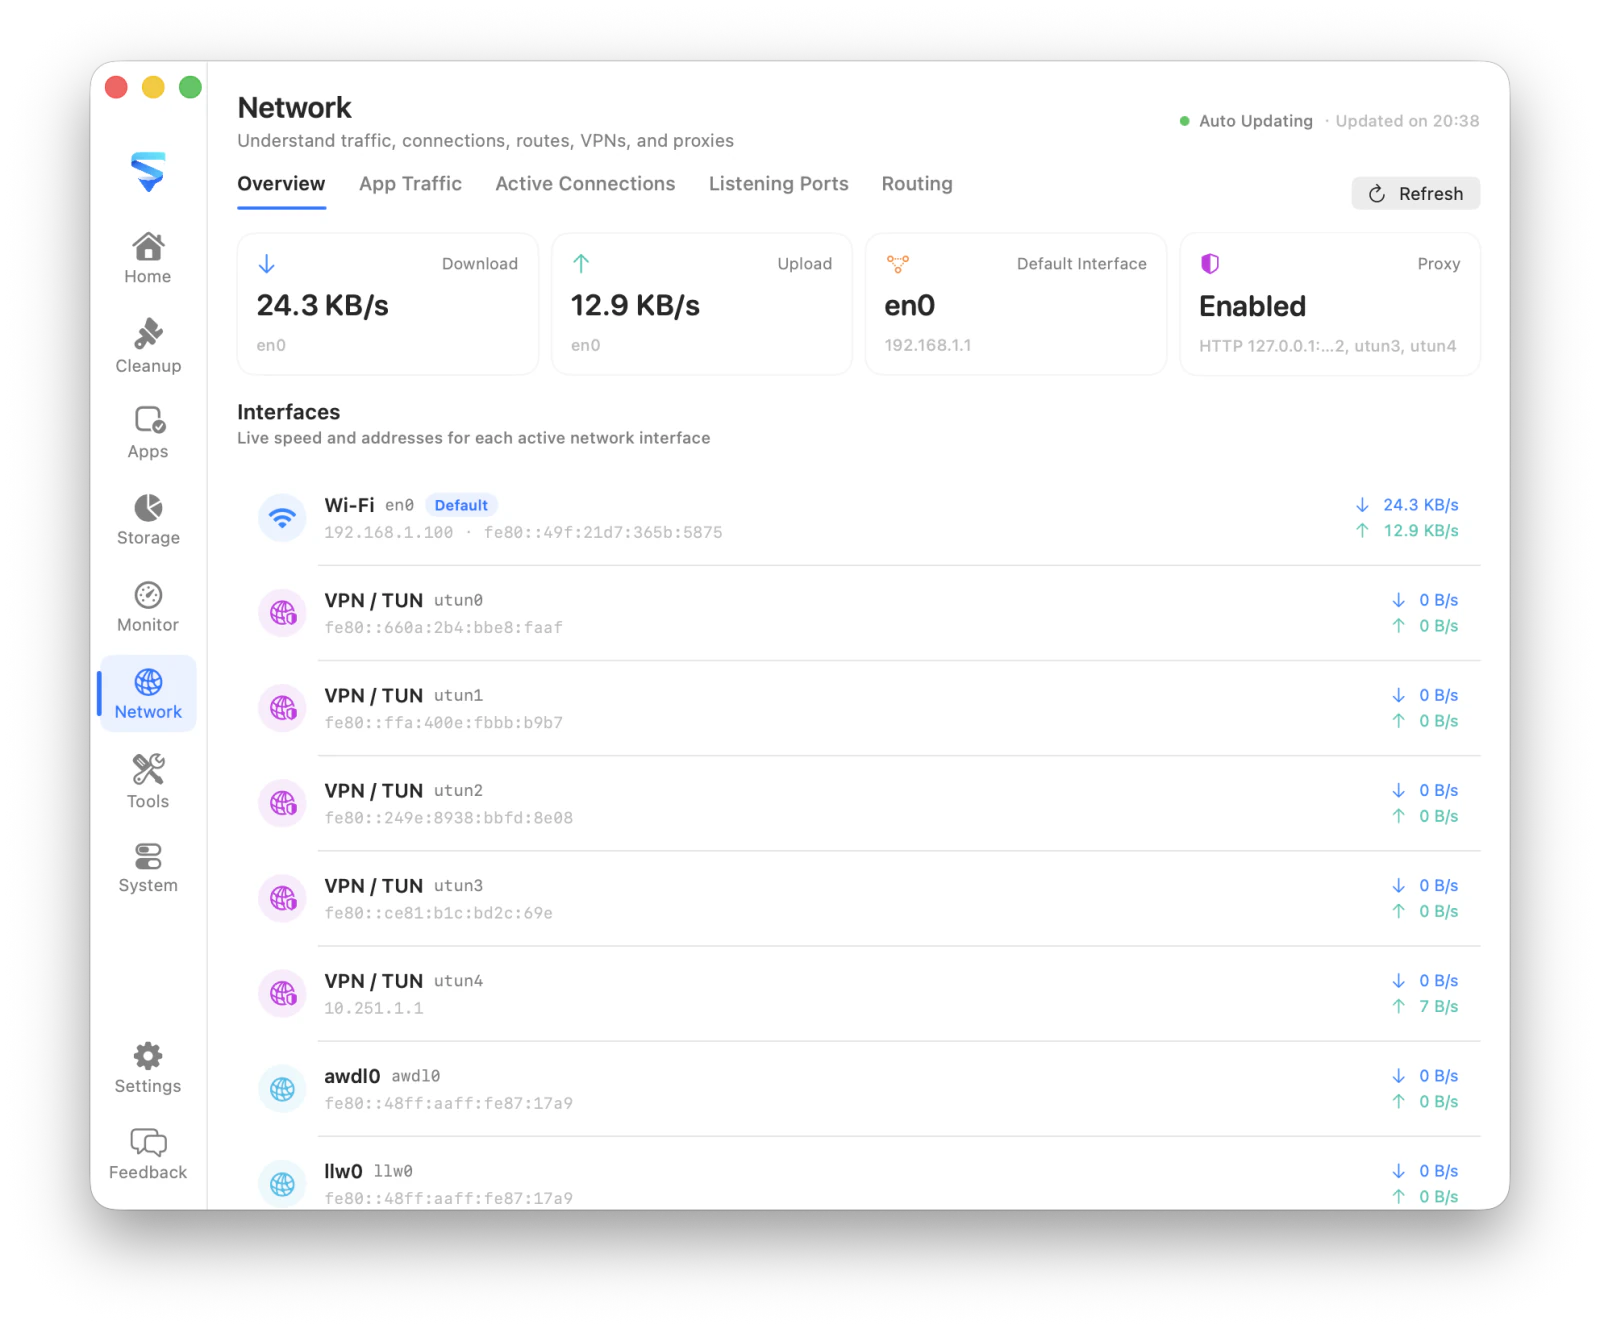
Follow upload and download speed, active interfaces, and per-process traffic.
Inspect remote connections, listeners, protocols, addresses, and owning processes.
See default routes, interface selection, VPN or TUN devices, and proxy state.
What it covers
Instead of showing only a total transfer rate, MachKit connects network activity with applications and processes. Filters make it easier to move from a busy connection to the executable and endpoint behind it.
Listening TCP ports and bound UDP ports are presented with protocol, address, process, and common service context. Process actions use safety checks and avoid system or unverified targets.
Review default and destination-specific routes alongside VPN, TUN, and proxy information. This makes common local development, corporate network, and debugging questions easier to answer.