Live system state
Follow CPU, memory pressure, thermal state, disk throughput, and network throughput.
Performance monitoring
MachKit combines live CPU, memory, thermal, disk, network, and per-app activity in one native Mac performance view. Sampling stays local and pauses when the relevant workspace is no longer active.
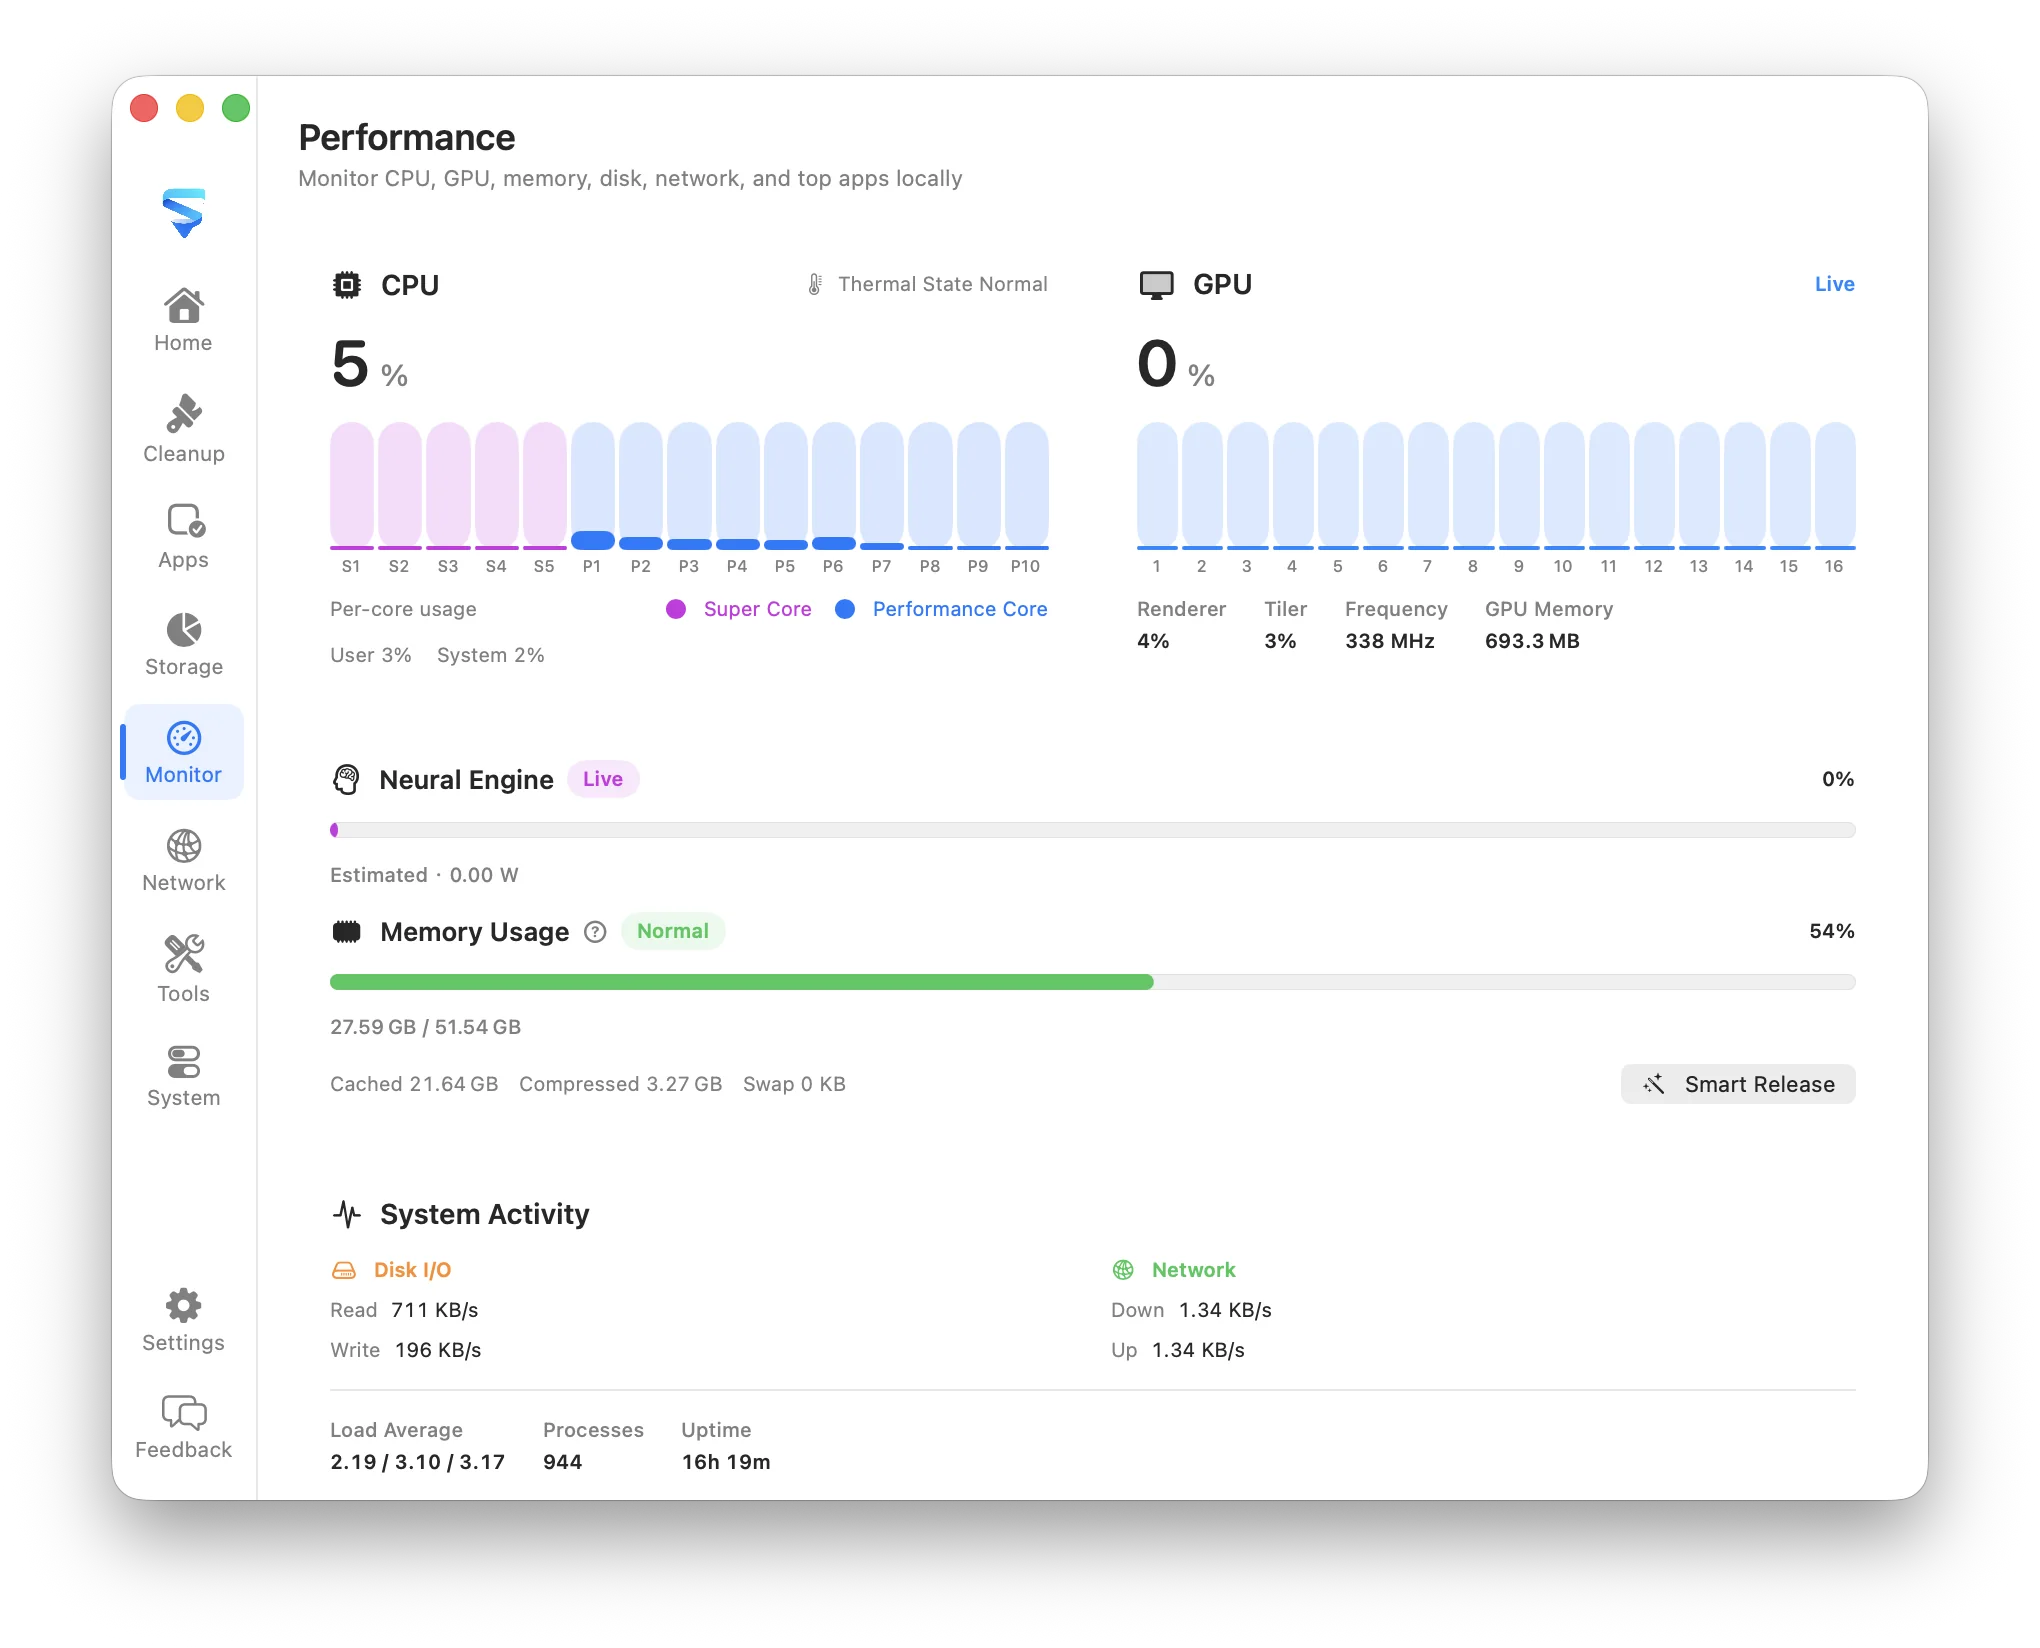
Follow CPU, memory pressure, thermal state, disk throughput, and network throughput.
Find running apps using the most CPU, memory, or network capacity.
Reuse shared baselines and slow inactive refreshes to avoid becoming the workload being measured.
What it covers
CPU percentages are only one part of performance. MachKit places processor activity next to memory pressure, physical memory, compressed memory, and thermal state so a slowdown has useful context.
Per-application rankings help identify the software responsible for current pressure. Helper processes inside an app bundle can be grouped with the parent application where the operating system exposes enough context.
Metrics come from macOS APIs and local system tools. MachKit does not upload performance samples, and inactive views reduce their refresh cadence instead of continuously performing full snapshots.